Prevalence
| Entry Date | Categories | Title | Content | hf:doc_categories | ||||||||||||||||||||||||||||||||||||||||||||||||||||||||||||||||||||||||||||||||||||||||||||||||||||||||||||||||||||||||||||||||||||||||||||||||||||||||||||||||||||||||||||||||||||||||||||||||||||||||||||||||||||||||||||||||||
|---|---|---|---|---|---|---|---|---|---|---|---|---|---|---|---|---|---|---|---|---|---|---|---|---|---|---|---|---|---|---|---|---|---|---|---|---|---|---|---|---|---|---|---|---|---|---|---|---|---|---|---|---|---|---|---|---|---|---|---|---|---|---|---|---|---|---|---|---|---|---|---|---|---|---|---|---|---|---|---|---|---|---|---|---|---|---|---|---|---|---|---|---|---|---|---|---|---|---|---|---|---|---|---|---|---|---|---|---|---|---|---|---|---|---|---|---|---|---|---|---|---|---|---|---|---|---|---|---|---|---|---|---|---|---|---|---|---|---|---|---|---|---|---|---|---|---|---|---|---|---|---|---|---|---|---|---|---|---|---|---|---|---|---|---|---|---|---|---|---|---|---|---|---|---|---|---|---|---|---|---|---|---|---|---|---|---|---|---|---|---|---|---|---|---|---|---|---|---|---|---|---|---|---|---|---|---|---|---|---|---|---|---|---|---|---|---|---|---|---|---|---|---|---|---|---|---|---|---|---|---|
| July 16, 2025 | Comorbidities and Risk Factors, Prevalence | Global Asthma Prevalence – Global Burden of Disease 2021 | According to the Global Burden of Disease study 2021, a systematic review and meta-analysis including data from 389 sources for asthma reported that in 2021 there was:
Modifiable risk factors were responsible for 30% of the global asthma DALY burden, particularly high BMI in high-socio-demograhic (SDI) index settings, and occupational asthmagens in low SDI settings.
| comorbidities-and-risk-factors prevalence | ||||||||||||||||||||||||||||||||||||||||||||||||||||||||||||||||||||||||||||||||||||||||||||||||||||||||||||||||||||||||||||||||||||||||||||||||||||||||||||||||||||||||||||||||||||||||||||||||||||||||||||||||||||||||||||||||||
| February 7, 2025 | Prevalence | Asthma prevalence trends 2001 to 2022 (AIHW) | According to AIHW, the prevalence of asthma has remained relatively stable (after adjusting for age structures over time) since 2001, at 12% in 2001 and 11% in 2022.(ref 1)
Previously, AIHW stated that the age-standardised asthma prevalence (based on National health Survey) is increasing (up to 2017-2018). (ref 2, 20 Jul 2022, not available online anymore)
| prevalence | ||||||||||||||||||||||||||||||||||||||||||||||||||||||||||||||||||||||||||||||||||||||||||||||||||||||||||||||||||||||||||||||||||||||||||||||||||||||||||||||||||||||||||||||||||||||||||||||||||||||||||||||||||||||||||||||||||
| February 7, 2025 | Prevalence | Prevalence and hospitalisations Maps by PHA, PHNs and LGAs 2021 (PHIDU) | This is a great resource if you required detailed breakdown within your state or territory to support grant applications or relevant government submissions. Note that previously PHIDU modelled data from the National Health Survey (NHS), currently prevalence is only available based on the Census 2021 data. AIHW and ABS recommend to rely on NHS prevalence data rather than Census when available. How to access the data: Long-term conditions (Census), by conditions (several age groups available) => select asthma in drop-down menu Admissions by principle diagnosis 2020/21 (male, female or persons) => select asthma Potentially Preventable Hospitalisations by Chronic Conditions 2020/21 => select asthma Make sure you include the type of map (PHN, LGA etc), indicator (e.g. asthma prevalence Census 2021) and date in your reference! E.g. Hospitalisations for asthma as principal diagnosis in 2020/21, at PHN level: https://phidu.torrens.edu.au/current/maps/sha-aust/phn_pha_single_map/atlas.html
Previous releases of the PHIDU including NHS 2017/2018 prevalence data (2021 release) can also be accessed at: https://phidu.torrens.edu.au/social-health-atlases/data-archive/data-archive-social-health-atlases-of-australia | prevalence | ||||||||||||||||||||||||||||||||||||||||||||||||||||||||||||||||||||||||||||||||||||||||||||||||||||||||||||||||||||||||||||||||||||||||||||||||||||||||||||||||||||||||||||||||||||||||||||||||||||||||||||||||||||||||||||||||||
| December 4, 2024 | Children and young people, Prevalence | Childhood asthma hotspots in Australia using Census 2021 data | Ecological study using data from the Census 2021 (self-reported asthma prevalence in 4,6 million aged 0-14) for spatial clustering using statistical area level 2 (SA2, a ‘suburb’ within cities and catchments of rural areas, population around 3000 to 25000) and statistical modelling. The study reported that: (ref 1) Concl/Discussion: Childhood asthma variation was found to be associated with area-level sociodemographic features, such as social deprivation and Indigenous density. These findings can be attributed to environmental features including socioeconomic deprivation, race or ethnicity, pollen, dust, exhaust pollutants, air pollution, violence, or crime, as well as limited access to healthcare because the majority of specialised paediatric asthma services are located in tertiary metropolitan hospitals. Note/Limitations: ecological studies can demonstrate associations rather than causal relationships, and parent-reported data may not be reliable due to reporting bias.
23 Hotspot Regions The hotspot suburbs with high asthma childhood prevalence were identified in 23 SA4 areas (regions/shires, mostly with a population over 100,000) listed below: (ref 1 and 3) Note: reference 3 is a Data on File ( UNSW Asthma hotspots – Childhood-Asthma-Clusters-Data-by-suburb-SA2-with-electorates .xlsx) provided by UNSW and can’t be shared without approval from UNSW.
Refer to attached file (Ref 3) for detail of hotspot suburbs (SA2s) included in each region (SA4). Reproduced from Ref 4:
UNSW data – Asthma Hotspots in WA and NT (ref 5): UNSW data on file – asthma hotspots WA – email J Khan 20 Jan 2026.pdf UNSW team shared with AA that 4 hotspot suburbs (SA2) out of 465 were located in WA, and none were located in NT:
Note that most areas in WA exhibited relatively low asthma prevalence. This pattern may reflect a combination of low population density, and the potential for underdiagnosis, particularly in remote communities. | children-and-young-people prevalence | ||||||||||||||||||||||||||||||||||||||||||||||||||||||||||||||||||||||||||||||||||||||||||||||||||||||||||||||||||||||||||||||||||||||||||||||||||||||||||||||||||||||||||||||||||||||||||||||||||||||||||||||||||||||||||||||||||
| December 3, 2024 | Aboriginal and Torres Strait Islander People, Comorbidities and Risk Factors, Prevalence | Prevalence, National Aboriginal and Torres Strait Islander Health Survey 2022-2023 (ABS) | The National Aboriginal and Torres Strait Islander Health Survey for the financial year 2022-2023 reported:
| aboriginal-and-torres-strait-islander-people comorbidities-and-risk-factors prevalence | ||||||||||||||||||||||||||||||||||||||||||||||||||||||||||||||||||||||||||||||||||||||||||||||||||||||||||||||||||||||||||||||||||||||||||||||||||||||||||||||||||||||||||||||||||||||||||||||||||||||||||||||||||||||||||||||||||
| July 3, 2024 | Prevalence | Prevalence compared to other countries | Asthma is one of the most common chronic conditions in Australia, with prevalence and mortality rates that are high by international comparisons | prevalence | ||||||||||||||||||||||||||||||||||||||||||||||||||||||||||||||||||||||||||||||||||||||||||||||||||||||||||||||||||||||||||||||||||||||||||||||||||||||||||||||||||||||||||||||||||||||||||||||||||||||||||||||||||||||||||||||||||
| July 3, 2024 | Children and young people, Prevalence | Childhood asthma prevalence in capital cities, modelling census data 2021 | New research using geographical modelling of the 2021 Census data to map the prevalence of asthma in children aged 5-14 reported:
| children-and-young-people prevalence | ||||||||||||||||||||||||||||||||||||||||||||||||||||||||||||||||||||||||||||||||||||||||||||||||||||||||||||||||||||||||||||||||||||||||||||||||||||||||||||||||||||||||||||||||||||||||||||||||||||||||||||||||||||||||||||||||||
| January 5, 2024 | Prevalence | Asthma prevalence 2022 (ABS, NHS) | According the National Health Survey 2022 (conducted with face-to-face interviews, the same methodology as the 2017-18 NHS), it is estimated that:
| prevalence | ||||||||||||||||||||||||||||||||||||||||||||||||||||||||||||||||||||||||||||||||||||||||||||||||||||||||||||||||||||||||||||||||||||||||||||||||||||||||||||||||||||||||||||||||||||||||||||||||||||||||||||||||||||||||||||||||||
| January 5, 2024 | Prevalence | Difference in prevalence by demographic data 2020-2021 (ABS, AIHW) | – People born in Australia compared to overseas:12.4% vs 7.3% in 2022 (ref 3); 12.6% compared to 6.0% in 2020-2021 (ref 1) Note: Data first entered in March 2022 then updated in May 2022 and January 2024. | prevalence | ||||||||||||||||||||||||||||||||||||||||||||||||||||||||||||||||||||||||||||||||||||||||||||||||||||||||||||||||||||||||||||||||||||||||||||||||||||||||||||||||||||||||||||||||||||||||||||||||||||||||||||||||||||||||||||||||||
| January 5, 2024 | Culturally and Linguistically Diverse Communities, Prevalence | Prevalence among migrant communities 2021 (AIHW, Census 2021) | According to the Census 2021, 3.6% of humanitarian entrants reported having asthma, a rate equal to other permanent migrants but 60% lower than the rest of the Australian population. | culturally-and-linguistically-diverse-communities prevalence | ||||||||||||||||||||||||||||||||||||||||||||||||||||||||||||||||||||||||||||||||||||||||||||||||||||||||||||||||||||||||||||||||||||||||||||||||||||||||||||||||||||||||||||||||||||||||||||||||||||||||||||||||||||||||||||||||||
| January 2, 2024 | Aboriginal and Torres Strait Islander People, Comorbidities and Risk Factors, Deaths, Emergency Department Presentations, Hospitalisation, Prevalence, Quality of life / burden of disease | A summary of asthma health among First Nations peoples 2018-2019 to 2021-2022 (AIHW) | AIHW report providing summary of epidemiological data in First Nations peoples with asthma (prevalence, risk factors, quality of life, burden of disease, mortality, hospitalisations, ED). This report provides a nice summary and a single reference. Prevalence (2018-2019 National Aboriginal and Torres Strait Islander Health survey (NATSIHS): Hospitalisation rates (2021-2022): Emergency Departments visits (2021-2022 Non-admitted Patient Emergency Department Care database): Mortality (2017-2021): Burden of Disease (Australian Burden of Disease Study 2018): Risk factors for First Nations people with asthma compared to those without asthma (2018–2019 NATSIHS): Quality of life (2018–2019 NATSIHS) for adult First nations people with asthma compared to those without asthma: Asthma Management in First Nations people with asthma (2018–2019 NATSIHS): | aboriginal-and-torres-strait-islander-people comorbidities-and-risk-factors deaths emergency-department-ed-presentations hospitalisation prevalence quality-of-life-burden-of-disease | ||||||||||||||||||||||||||||||||||||||||||||||||||||||||||||||||||||||||||||||||||||||||||||||||||||||||||||||||||||||||||||||||||||||||||||||||||||||||||||||||||||||||||||||||||||||||||||||||||||||||||||||||||||||||||||||||||
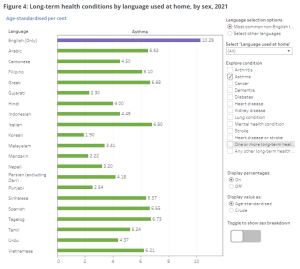
| February 17, 2023 | Culturally and Linguistically Diverse Communities, Prevalence | Prevalence among culturally and linguistically diverse communities 2021 (AIHW, Census 2021) | Based on the Census 2021 data: Figures are displayed below. Factors can be combined (e.g. time since arrival and proficiency in English)
Top 5 are anglo-saxon cultural background! Age-standardised asthma prevalence by language used at home:
reference for % population speaking this language: Australian Bureau of Statistics. Cultural diversity: Census [Internet]. Canberra: ABS; 2021 [cited 2023 June 16]. Available from: https://www.abs.gov.au/statistics/people/people-and-communities/cultural-diversity-census/latest-release. | culturally-and-linguistically-diverse-communities prevalence | ||||||||||||||||||||||||||||||||||||||||||||||||||||||||||||||||||||||||||||||||||||||||||||||||||||||||||||||||||||||||||||||||||||||||||||||||||||||||||||||||||||||||||||||||||||||||||||||||||||||||||||||||||||||||||||||||||
| July 27, 2022 | Children and young people, Prevalence | Asthma prevalence in Census 2021 (ABS, PHIDU) | The Census 2021 data was released, including a question on whether people had asthma. The ABS media release reported:(ref 1) Note: ABS recommends to use the National Health Survey rather than the Census as definite and correct source for national prevalence rates. PHIDU maps: (ref 2) The Public Health Information Development Unit has mapped the results from the ABS Census 2021, including asthma prevalence.
Data can be visualised for ages 0-14, 15+ or all-ages, and by states and territories, Local Government Areas (LGAs), Population Health Areas (PHAs) or Public Health Networks (PHNs) here: https://phidu.torrens.edu.au/social-health-atlases/maps#2021-census-population-health-areas
| children-and-young-people prevalence | ||||||||||||||||||||||||||||||||||||||||||||||||||||||||||||||||||||||||||||||||||||||||||||||||||||||||||||||||||||||||||||||||||||||||||||||||||||||||||||||||||||||||||||||||||||||||||||||||||||||||||||||||||||||||||||||||||
| July 20, 2022 | Children and young people, Prevalence | Asthma prevalence 2020-2021 (ABS, NHS) | According the National Health Survey for 2020-2021 (a year impacted by the Covid pandemic), it is estimated that:
| children-and-young-people prevalence | ||||||||||||||||||||||||||||||||||||||||||||||||||||||||||||||||||||||||||||||||||||||||||||||||||||||||||||||||||||||||||||||||||||||||||||||||||||||||||||||||||||||||||||||||||||||||||||||||||||||||||||||||||||||||||||||||||
| June 22, 2022 | Aboriginal and Torres Strait Islander People, Prevalence | Prevalence among First Nations peoples by remoteness 2018-2019 (ABS) | The prevalence of asthma was about twice as high for Aboriginal and Torres Strait Islander people living in non-remote areas (17%) compared with those living in remote areas (9%) in 2018-19. | aboriginal-and-torres-strait-islander-people prevalence | ||||||||||||||||||||||||||||||||||||||||||||||||||||||||||||||||||||||||||||||||||||||||||||||||||||||||||||||||||||||||||||||||||||||||||||||||||||||||||||||||||||||||||||||||||||||||||||||||||||||||||||||||||||||||||||||||||
| October 12, 2021 | Aboriginal and Torres Strait Islander People, Prevalence | Prevalence in First Nations peoples in 2012-2013 (ABS) | In 2012–13, 18% of Aboriginal and Torres Strait Islander Australians had asthma (an estimated 111,900 people), with a higher rate among females (20%) compared with males (15%).
| aboriginal-and-torres-strait-islander-people prevalence | ||||||||||||||||||||||||||||||||||||||||||||||||||||||||||||||||||||||||||||||||||||||||||||||||||||||||||||||||||||||||||||||||||||||||||||||||||||||||||||||||||||||||||||||||||||||||||||||||||||||||||||||||||||||||||||||||||
| October 12, 2021 | Prevalence | Asthma prevalence 2017-2018 (ABS, AIHW) | In 2017-18, about one in nine Australians had been diagnosed with asthma (11% or total population, approximately 2.7 million people), based on self-reported data from the 2017–2018 Australian Bureau of Statistics (ABS) National Health Survey (NHS) (Ref 1) See tables (ref 1) and graph (ref 2) below for prevalence by age, gender and jurisdiction. Note: the data refers to self-reported asthma (diagnosed by doctor or nurse), collected during the National Health Survey 2017-2018 financial year.
Prevalence 2017-18 by age and sex: AIHW (entry date 29 July 2022). To get actual prevalence rate for each stratum, go to the AIHW webpage, Fig 2 and hover our mouse over the bar of interest.
| prevalence | ||||||||||||||||||||||||||||||||||||||||||||||||||||||||||||||||||||||||||||||||||||||||||||||||||||||||||||||||||||||||||||||||||||||||||||||||||||||||||||||||||||||||||||||||||||||||||||||||||||||||||||||||||||||||||||||||||
| October 12, 2021 | Aboriginal and Torres Strait Islander People, Prevalence, State specific resources | Prevalance in First Nations 2018-2019 (AIHW) | Based on the National Aboriginal and Torres Strait Islander Survey 2018-2019 15.7% Indigenous Australians reported having asthma in 2018-2019: 13.4% of males and 15.7% of females (ref 1) An estimated 128,000 Aboriginal and Torres Strait Islander people had asthma in 2018-2019 (16%), with a higher rate among females (18%) compared with males (13%). The prevalence of asthma among Indigenous Australians was was 1.6 times as high as non-Indigenous Australians after adjusting for difference in age structure, and the difference is more marked for older adults. (ref 4) Asthma was the third most prevalent chronic condition in Aboriginal and Torres Strait Islander people. (ref 3) Asthma was the most commonly self-reported long-term respiratory condition in 2018-2019 in Aboriginal and Torres Strait Islander people. (ref 1) Prevalence by age groups: 11.5% of 0-14 yo; 13.8% of 15-24 yo; 15% of 25-34 yo; 17% of 35-44 yo; 20.8% of 45-54 yo; 25.8% of 55+ yo reported having asthma (ref 1 or ref 2) Prevalence by jurisdictions: 18.6% in NSW; 18.0% in VIC; 13.7% in QLD; 12.6% in WA; 22.7% in SA; 21.9% in TAS; 25.3% in ACT; and 6.2% in NT (ref 2). Note: these statistics are also available stratified by remote/non-remote status in Table D1.04.20 | aboriginal-and-torres-strait-islander-people prevalence state-specific-resources | ||||||||||||||||||||||||||||||||||||||||||||||||||||||||||||||||||||||||||||||||||||||||||||||||||||||||||||||||||||||||||||||||||||||||||||||||||||||||||||||||||||||||||||||||||||||||||||||||||||||||||||||||||||||||||||||||||
| July 1, 2021 | Deaths, Hospitalisation, Prevalence | Asthma Atlas for local state and territory breakdowns (PHIDU 2019) – NOT ACCESSIBLE | AA commissioned the PHIDU team to create an Asthma Atlas with prevalence, AAP ownership, hospitalisations, and deaths. It breaks the data down by Commonwealth Electorate Divisions (CED), Population Health Areas (PHAs) and Statistical Area 3 (SA3). The data is modelled using 2016/17 hospitalisation data which is not the most updated national or state/territory level data we have. However, this is very useful if you need data broken down by a local level. Note (Feb 2024): this link is not accessible anymore, and PHIDU has updated their Social Health Atlas maps with the following asthma-specific data: Census 2021 data (for prevalence), asthma hospital admissions 2020/21; asthma potentially preventable hospitalisations 2020/21. Previous releases of the PHIDU including NHS 2017/2018 prevalence data (2021 release) can be accessed at: https://phidu.torrens.edu.au/social-health-atlases/data-archive/data-archive-social-health-atlases-of-australia
| deaths hospitalisation prevalence | ||||||||||||||||||||||||||||||||||||||||||||||||||||||||||||||||||||||||||||||||||||||||||||||||||||||||||||||||||||||||||||||||||||||||||||||||||||||||||||||||||||||||||||||||||||||||||||||||||||||||||||||||||||||||||||||||||