Aboriginal and Torres Strait Islander People
| Entry Date | Categories | Title | Content | hf:doc_categories | ||||||||||||||||||||||||||||||||||||||||||||||||||||||||||||||||||||||||||||||||||||||||||||||||||||||||||||||||||||||||||||||||||||||||||||||||||||||||||||||
|---|---|---|---|---|---|---|---|---|---|---|---|---|---|---|---|---|---|---|---|---|---|---|---|---|---|---|---|---|---|---|---|---|---|---|---|---|---|---|---|---|---|---|---|---|---|---|---|---|---|---|---|---|---|---|---|---|---|---|---|---|---|---|---|---|---|---|---|---|---|---|---|---|---|---|---|---|---|---|---|---|---|---|---|---|---|---|---|---|---|---|---|---|---|---|---|---|---|---|---|---|---|---|---|---|---|---|---|---|---|---|---|---|---|---|---|---|---|---|---|---|---|---|---|---|---|---|---|---|---|---|---|---|---|---|---|---|---|---|---|---|---|---|---|---|---|---|---|---|---|---|---|---|---|---|---|---|---|---|---|---|---|---|
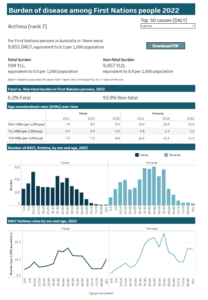
| May 22, 2026 | Aboriginal and Torres Strait Islander People, Quality of life / burden of disease | First Nations Burden of Disease (AIHW 2022) | The First Nations Burden of Disease Study 2022:
The DALY rate is particularly high for females 40-60 years of age (see graphs below)
| aboriginal-and-torres-strait-islander-people quality-of-life-burden-of-disease | ||||||||||||||||||||||||||||||||||||||||||||||||||||||||||||||||||||||||||||||||||||||||||||||||||||||||||||||||||||||||||||||||||||||||||||||||||||||||||||||
| December 17, 2025 | Aboriginal and Torres Strait Islander People, Emergency Department Presentations, Social Determinants of Health | Emergency Department (ED) presentations 2024-2025 (AIHW) | AIHW Emergency department care (ref 1): In 2024-2025 there were about 92,000 presentations to the Emergency Department of public hospitals with asthma. (ref 1)* Specifically 91,480 presentations with asthma were recorded across complexity level A, B and C, of which: *ED presentations included all types of visits, including Emergency presentation but also Return planned visit (e.g for Follow-up treatment, test results etc), pre-arranged admission and dead on arrival (without resuscitation attempt) (see https://meteor.aihw.gov.au/content/684942) Note: This data differs from AIHW asthma webpage which lists ED due to asthma (asthma as the principal diagnosis) Note: the number of admissions here is different from the hospitalisation number provided through the AIHW “Admitted Patient Care”. Admitted patient care provides a count of hospitalisations with asthma as principal diagnosis (i.e. main reason for hospitalisation) AIHW Asthma webpage (ref 2): In 2024-25, there were:
Fig 3 from AIHW: ED rates with asthma as principal diagnosis, by age and sex (ref 2)
ED rate (age standardised) trends from 2018-19 to 2024-25 (ref 2):
| aboriginal-and-torres-strait-islander-people emergency-department-ed-presentations social-determinants-of-health | ||||||||||||||||||||||||||||||||||||||||||||||||||||||||||||||||||||||||||||||||||||||||||||||||||||||||||||||||||||||||||||||||||||||||||||||||||||||||||||||
| July 9, 2025 | Aboriginal and Torres Strait Islander People, Children and young people, Hospitalisation | Asthma hospitalisations 2023-2024 (AIHW) | Asthma hospitalisations 2023 – 2024 (AIHW) Children under 15 accounted for 43% of all asthma hospitalisations.(ref 1) In 2023-2024, 90% of asthma hospitalisations were potentially preventable.(ref1, 3)
*PPH: Potentially Preventable Hospitalisations (hospitalisations for asthma in people 4 years and over).
According to AIHW asthma webpage (ref 4), in 2023-24 there were:
Hospitalisation rates (ref 4):
| aboriginal-and-torres-strait-islander-people children-and-young-people hospitalisation | ||||||||||||||||||||||||||||||||||||||||||||||||||||||||||||||||||||||||||||||||||||||||||||||||||||||||||||||||||||||||||||||||||||||||||||||||||||||||||||||
| May 30, 2025 | Aboriginal and Torres Strait Islander People, Hospitalisation, State specific resources | Potentially preventable hospitalisations 2023-2024 (AIHW) | In 2023-2024, there were 28,778 potentially preventable hospitalisations (PPH) due to asthma. (ref 1). This is similar to the year before with 28,238 PPH in 2022-2023, compared to 22,985 in 2021-2022 (a year with pandemic measures), and 32,558 in 2018-2019 before the COVID pandemic. (ref 2) Note: Asthma PPH are all hospitalisations with asthma as principal diagnosis in people aged 4 and over. Asthma PPH by jurisdiction (2023-24)
Asthma PPH rate (per 1,000 people) by Indigenous status and state or territory of residence, 2023-2024 (ref 3)
(c) Includes other territories, overseas residents and unknown state of residence. | aboriginal-and-torres-strait-islander-people hospitalisation state-specific-resources | ||||||||||||||||||||||||||||||||||||||||||||||||||||||||||||||||||||||||||||||||||||||||||||||||||||||||||||||||||||||||||||||||||||||||||||||||||||||||||||||
| December 3, 2024 | Aboriginal and Torres Strait Islander People, Comorbidities and Risk Factors, Prevalence | Prevalence, National Aboriginal and Torres Strait Islander Health Survey 2022-2023 (ABS) | The National Aboriginal and Torres Strait Islander Health Survey for the financial year 2022-2023 reported:
| aboriginal-and-torres-strait-islander-people comorbidities-and-risk-factors prevalence | ||||||||||||||||||||||||||||||||||||||||||||||||||||||||||||||||||||||||||||||||||||||||||||||||||||||||||||||||||||||||||||||||||||||||||||||||||||||||||||||
| November 13, 2024 | Aboriginal and Torres Strait Islander People, Deaths, State specific resources | Deaths/mortality 2023 (ABS, NAC, AIHW) | In 2023, there were 474 deaths with asthma as underlying cause in Australia, including 325 females and 149 males (see table below) (ref 1): The age-standardised death rate in 2023 was 1.4 deaths per 100,000 people (1.7 for females and 1.0 for males) which remains similar to before the pandemic. (ref 1) Asthma deaths by state/territory and sex 2023 (ref 1)
NAC infographic (ref 2)
According the AIHW Asthma webpage updated on 17 Feb 2026:(ref 4) 480 people died from asthma (underlying cause) in 2023, with a death rate (not adjusted for age) of 1.8 deaths per 100,000 population. Mortality rates:
| aboriginal-and-torres-strait-islander-people deaths state-specific-resources | ||||||||||||||||||||||||||||||||||||||||||||||||||||||||||||||||||||||||||||||||||||||||||||||||||||||||||||||||||||||||||||||||||||||||||||||||||||||||||||||
| June 21, 2024 | Aboriginal and Torres Strait Islander People | Closing the Gap Dashboard 2023 (Australian Productivity Commission) – Resource | Provides the most up-to-date information available on the targets and indicators in the National Agreement on Closing the Gap (the Agreement). Not asthma-specific | aboriginal-and-torres-strait-islander-people | ||||||||||||||||||||||||||||||||||||||||||||||||||||||||||||||||||||||||||||||||||||||||||||||||||||||||||||||||||||||||||||||||||||||||||||||||||||||||||||||
| June 21, 2024 | Aboriginal and Torres Strait Islander People | Aboriginal and Torres Strait Islander Health 2023 (Health Infonet) – Resource | The Overview of Aboriginal and Torres Strait Islander health status 2023 (Overview) aims to provide a comprehensive outline of the current health status of Aboriginal and Torres Strait Islander people. | aboriginal-and-torres-strait-islander-people | ||||||||||||||||||||||||||||||||||||||||||||||||||||||||||||||||||||||||||||||||||||||||||||||||||||||||||||||||||||||||||||||||||||||||||||||||||||||||||||||
| March 14, 2024 | Aboriginal and Torres Strait Islander People, Hospitalisation, State specific resources | Hospitalisations rate in First Nations people vs other Australians by state or territory 2024 (Aus Gov Productivity Commission) | Age-standardised asthma hospitalisation rate in 2021-2022 in First Nations people vs other Australians, by jurisdictions: | aboriginal-and-torres-strait-islander-people hospitalisation state-specific-resources | ||||||||||||||||||||||||||||||||||||||||||||||||||||||||||||||||||||||||||||||||||||||||||||||||||||||||||||||||||||||||||||||||||||||||||||||||||||||||||||||
| January 4, 2024 | Aboriginal and Torres Strait Islander People, State specific resources | Aboriginal and Torres Strait Islander statistics by geographical areas 2024 (AIHW) – Resource | AIHW has a website specifically for Aboriginal and Torres Strait Islander people, providing statistics by geographical areas, including: | aboriginal-and-torres-strait-islander-people state-specific-resources | ||||||||||||||||||||||||||||||||||||||||||||||||||||||||||||||||||||||||||||||||||||||||||||||||||||||||||||||||||||||||||||||||||||||||||||||||||||||||||||||
| January 2, 2024 | Aboriginal and Torres Strait Islander People, Comorbidities and Risk Factors, Deaths, Emergency Department Presentations, Hospitalisation, Prevalence, Quality of life / burden of disease | A summary of asthma health among First Nations peoples 2018-2019 to 2021-2022 (AIHW) | AIHW report providing summary of epidemiological data in First Nations peoples with asthma (prevalence, risk factors, quality of life, burden of disease, mortality, hospitalisations, ED). This report provides a nice summary and a single reference. Prevalence (2018-2019 National Aboriginal and Torres Strait Islander Health survey (NATSIHS): Hospitalisation rates (2021-2022): Emergency Departments visits (2021-2022 Non-admitted Patient Emergency Department Care database): Mortality (2017-2021): Burden of Disease (Australian Burden of Disease Study 2018): Risk factors for First Nations people with asthma compared to those without asthma (2018–2019 NATSIHS): Quality of life (2018–2019 NATSIHS) for adult First nations people with asthma compared to those without asthma: Asthma Management in First Nations people with asthma (2018–2019 NATSIHS): | aboriginal-and-torres-strait-islander-people comorbidities-and-risk-factors deaths emergency-department-ed-presentations hospitalisation prevalence quality-of-life-burden-of-disease | ||||||||||||||||||||||||||||||||||||||||||||||||||||||||||||||||||||||||||||||||||||||||||||||||||||||||||||||||||||||||||||||||||||||||||||||||||||||||||||||
| January 2, 2024 | Aboriginal and Torres Strait Islander People, Deaths | Deaths among First Nations peoples compared to other Australians between 2017 and 2021 (AIHW) | Over the 5-year period 2017-2021 (including years of COVID-pandemic measures), there were: | aboriginal-and-torres-strait-islander-people deaths | ||||||||||||||||||||||||||||||||||||||||||||||||||||||||||||||||||||||||||||||||||||||||||||||||||||||||||||||||||||||||||||||||||||||||||||||||||||||||||||||
| January 2, 2024 | Aboriginal and Torres Strait Islander People, Hospitalisation | Hospitalisations among first Nations people in 2021-2022 vs 2018-2019 (AIHW) | In 2021-2022, a year affected by Covid-129 pandemic measures, there were: | aboriginal-and-torres-strait-islander-people hospitalisation | ||||||||||||||||||||||||||||||||||||||||||||||||||||||||||||||||||||||||||||||||||||||||||||||||||||||||||||||||||||||||||||||||||||||||||||||||||||||||||||||
| October 10, 2023 | Aboriginal and Torres Strait Islander People, Deaths | Avoidable deaths among First Nations peoples compared to other Australians 2018 (AIHW) | In 2018, almost two-thirds (64%) of the fatal burden among Aboriginal and Torres Strait Islander (First Nations) people was classified as avoidable (preventable), compared to 54% in non-Indigenous Australians. | aboriginal-and-torres-strait-islander-people deaths | ||||||||||||||||||||||||||||||||||||||||||||||||||||||||||||||||||||||||||||||||||||||||||||||||||||||||||||||||||||||||||||||||||||||||||||||||||||||||||||||
| February 14, 2023 | Aboriginal and Torres Strait Islander People, Asthma Action Plan, Medication use and asthma control | Asthma Action Plan ownership and medication use among First Nations peoples 2018-2019 (AIHW) | In 2018-2019, among Aboriginal and Torres Strait Islander people with asthma that had symptoms in the last 12 months: | aboriginal-and-torres-strait-islander-people asthma-action-plan medication-use-and-asthma-control | ||||||||||||||||||||||||||||||||||||||||||||||||||||||||||||||||||||||||||||||||||||||||||||||||||||||||||||||||||||||||||||||||||||||||||||||||||||||||||||||
| February 14, 2023 | Aboriginal and Torres Strait Islander People, Deaths | Deaths in First Nations peoples compared to other Australians between 2015 and 2019 (AIHW) | The age-standardised mortality rate due to asthma among Aboriginal and Torres Strait Islander people was 2.5 times as high as among other Australians in 2015-2019 (3.7 compared with 1.5 per 100,000 population over the 2015-2019 period). By gender, it was 2.7 vs 1.1 per 1,000 (2.5 times higher) in males, and 4.4 vs 1.8 per 1,000 (2.4 times higher) in females. | aboriginal-and-torres-strait-islander-people deaths | ||||||||||||||||||||||||||||||||||||||||||||||||||||||||||||||||||||||||||||||||||||||||||||||||||||||||||||||||||||||||||||||||||||||||||||||||||||||||||||||
| February 14, 2023 | Aboriginal and Torres Strait Islander People, Hospitalisation | Hospitalisations among First Nations peoples between 2017 and 2019 (AIHW) | Between 2017 and 2019, Aboriginal and Torres Strait Islander people were 80% more likelly to be hospitalised for asthma than other Australians, with an age standardised asthma hospitalisation rate of 2.7 per 1,000 people, and an asthma hospitalisation rate ratio of 1.8 (rate difference 1.2 per 1,000) compared to non-Indigenous Australians. By age groups, the asthma hospitalisation rates for 2017-2019 were: | aboriginal-and-torres-strait-islander-people hospitalisation | ||||||||||||||||||||||||||||||||||||||||||||||||||||||||||||||||||||||||||||||||||||||||||||||||||||||||||||||||||||||||||||||||||||||||||||||||||||||||||||||
| June 22, 2022 | Aboriginal and Torres Strait Islander People, Reports | Asthma Australia data report on Aboriginal and Torres Strait Islander health 2022 – AA Resource | This internal data report discussed prevalence, mortality, burden of disease, gap, remoteness, risk factors, demographic considerations, in relation to: Provides comprehensive epidemiological information, as well as key facts. Report: https://asthmafoundation.sharepoint.com/:w:/s/RPA/EZVD72ep5AZPpgs1RXRvDu4BTuP0TRYeYGIIfyT7wh94Gw?e=ZN7RMn Summary Presentation: https://asthmafoundation.sharepoint.com/:w:/s/RPA/EZVD72ep5AZPpgs1RXRvDu4BTuP0TRYeYGIIfyT7wh94Gw?e=ZN7RMn These resources are for internal use only, please do not distribute the report and presentation externally. | aboriginal-and-torres-strait-islander-people reports | ||||||||||||||||||||||||||||||||||||||||||||||||||||||||||||||||||||||||||||||||||||||||||||||||||||||||||||||||||||||||||||||||||||||||||||||||||||||||||||||
| June 22, 2022 | Aboriginal and Torres Strait Islander People, Prevalence | Prevalence among First Nations peoples by remoteness 2018-2019 (ABS) | The prevalence of asthma was about twice as high for Aboriginal and Torres Strait Islander people living in non-remote areas (17%) compared with those living in remote areas (9%) in 2018-19. | aboriginal-and-torres-strait-islander-people prevalence | ||||||||||||||||||||||||||||||||||||||||||||||||||||||||||||||||||||||||||||||||||||||||||||||||||||||||||||||||||||||||||||||||||||||||||||||||||||||||||||||
| June 22, 2022 | Aboriginal and Torres Strait Islander People, Deaths | Deaths in First Nations peoples compared to other Australians between 2014 and 2018 (AIHW) | The age-standardised mortality rate due to asthma among Aboriginal and Torres Strait Islander people was 2.2 times as high as among other Australians in 2014-2018 (3.4 compared with 1.5 per 100,000 population). | aboriginal-and-torres-strait-islander-people deaths | ||||||||||||||||||||||||||||||||||||||||||||||||||||||||||||||||||||||||||||||||||||||||||||||||||||||||||||||||||||||||||||||||||||||||||||||||||||||||||||||
| October 12, 2021 | Aboriginal and Torres Strait Islander People, Prevalence | Prevalence in First Nations peoples in 2012-2013 (ABS) | In 2012–13, 18% of Aboriginal and Torres Strait Islander Australians had asthma (an estimated 111,900 people), with a higher rate among females (20%) compared with males (15%).
| aboriginal-and-torres-strait-islander-people prevalence | ||||||||||||||||||||||||||||||||||||||||||||||||||||||||||||||||||||||||||||||||||||||||||||||||||||||||||||||||||||||||||||||||||||||||||||||||||||||||||||||
| October 12, 2021 | Aboriginal and Torres Strait Islander People, Prevalence, State specific resources | Prevalance in First Nations 2018-2019 (AIHW) | Based on the National Aboriginal and Torres Strait Islander Survey 2018-2019 15.7% Indigenous Australians reported having asthma in 2018-2019: 13.4% of males and 15.7% of females (ref 1) An estimated 128,000 Aboriginal and Torres Strait Islander people had asthma in 2018-2019 (16%), with a higher rate among females (18%) compared with males (13%). The prevalence of asthma among Indigenous Australians was was 1.6 times as high as non-Indigenous Australians after adjusting for difference in age structure, and the difference is more marked for older adults. (ref 4) Asthma was the third most prevalent chronic condition in Aboriginal and Torres Strait Islander people. (ref 3) Asthma was the most commonly self-reported long-term respiratory condition in 2018-2019 in Aboriginal and Torres Strait Islander people. (ref 1) Prevalence by age groups: 11.5% of 0-14 yo; 13.8% of 15-24 yo; 15% of 25-34 yo; 17% of 35-44 yo; 20.8% of 45-54 yo; 25.8% of 55+ yo reported having asthma (ref 1 or ref 2) Prevalence by jurisdictions: 18.6% in NSW; 18.0% in VIC; 13.7% in QLD; 12.6% in WA; 22.7% in SA; 21.9% in TAS; 25.3% in ACT; and 6.2% in NT (ref 2). Note: these statistics are also available stratified by remote/non-remote status in Table D1.04.20 | aboriginal-and-torres-strait-islander-people prevalence state-specific-resources | ||||||||||||||||||||||||||||||||||||||||||||||||||||||||||||||||||||||||||||||||||||||||||||||||||||||||||||||||||||||||||||||||||||||||||||||||||||||||||||||
| October 8, 2021 | Aboriginal and Torres Strait Islander People, Quality of life / burden of disease | Burden of Disease in First Nations peoples 2018 (AIHW) | According to the Australian Burden of Disease Study 2018, asthma was, in First Nations people: (ref 1) Comment: Note important variation between age-standardised (below) and crude (above) burden of disease ranking for First Nations people, due to the differences in age structure between First Nations (younger population) and non-Indigenous Australians. Key findings from the Australian Burden of Disease Study (ABDS) 2018 also include: | aboriginal-and-torres-strait-islander-people quality-of-life-burden-of-disease | ||||||||||||||||||||||||||||||||||||||||||||||||||||||||||||||||||||||||||||||||||||||||||||||||||||||||||||||||||||||||||||||||||||||||||||||||||||||||||||||
| July 1, 2021 | Aboriginal and Torres Strait Islander People, Deaths | Deaths in First Nations peoples compared to other Australians between 2011 and 2015 (AIHW) | Indigenous Australians have higher asthma mortality rates compared to non-Indigenous Australians, after adjusting for differences in age structure. Between 2011 to 2015, the mortality rate for asthma among Indigenous Australians was 2.8 per 100,000 population, twice that of non-Indigenous Australians (1.4 per 100,000), based on the five jurisdictions with adequate Indigenous identification (NSW, Qld, NT, WA and SA). | aboriginal-and-torres-strait-islander-people deaths | ||||||||||||||||||||||||||||||||||||||||||||||||||||||||||||||||||||||||||||||||||||||||||||||||||||||||||||||||||||||||||||||||||||||||||||||||||||||||||||||