Quality of life / burden of disease
| Entry Date | Categories | Title | Content | hf:doc_categories | |||||||||||||||||||||||||||||||||||||||||||||||||||||||||||||||||||||||||||||||||||||||||||
|---|---|---|---|---|---|---|---|---|---|---|---|---|---|---|---|---|---|---|---|---|---|---|---|---|---|---|---|---|---|---|---|---|---|---|---|---|---|---|---|---|---|---|---|---|---|---|---|---|---|---|---|---|---|---|---|---|---|---|---|---|---|---|---|---|---|---|---|---|---|---|---|---|---|---|---|---|---|---|---|---|---|---|---|---|---|---|---|---|---|---|---|---|---|---|---|
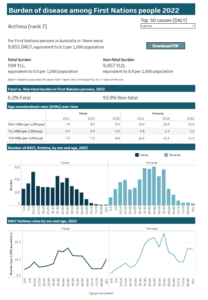
| May 22, 2026 | Aboriginal and Torres Strait Islander People, Quality of life / burden of disease | First Nations Burden of Disease (AIHW 2022) | The First Nations Burden of Disease Study 2022:
The DALY rate is particularly high for females 40-60 years of age (see graphs below)
| aboriginal-and-torres-strait-islander-people quality-of-life-burden-of-disease | |||||||||||||||||||||||||||||||||||||||||||||||||||||||||||||||||||||||||||||||||||||||||||
| January 31, 2025 | Comorbidities and Risk Factors, Quality of life / burden of disease | Quality of life 2022 (AIHW, NHS 2022) | According to self-reported data from the NHS 2022, amongst people with asthma aged 18 and over: | comorbidities-and-risk-factors quality-of-life-burden-of-disease | |||||||||||||||||||||||||||||||||||||||||||||||||||||||||||||||||||||||||||||||||||||||||||
| December 24, 2024 | Children and young people, Comorbidities and Risk Factors, Quality of life / burden of disease | Burden of disease 2024 (AIHW) | Information from the burden of Disease study 2024:(ref 1) In 2024, Asthma was the 10th leading contributor to the total burden of disease in Australia with a disability-adjusted life years (DALY) rate of 5.35 per 1,000 population (143,782 DALY, crude number), similar to 2023 By gender: By age groups (age-specific DALY per 1,000), asthma ranked as leading cause of total burden of disease: Note: to compare epidemiological data, it is usually preferred to use age-standardised statistics to ensure the differences are not caused by variations in age structure and an ageing population, unless the data is for specific age ranges in which case “crude” age-specific statistics are used. Figure 3.5: Disease- or injury-specific summary of disease burden in Australia: Asthma
Risk factors attributable burden of asthma: it was estimated that in 2024 Additional information reported in AIHW Asthma webpage: (ref 2) In 2024, asthma accounted for:
The rate of burden from asthma was higher in females vs males (1.2 times higher with 5.8 vs 4.9 DALY per 100,000 population) Trends over time: The age-adjusted rate of burden due to asthma increased between 2003 and 2024 from 4.9 to 5.3 DALY per 100,000. The increase was driven by non-fatal burden. Age-standardised DALY rates due to asthma, 2003 to 2024:
| children-and-young-people comorbidities-and-risk-factors quality-of-life-burden-of-disease | |||||||||||||||||||||||||||||||||||||||||||||||||||||||||||||||||||||||||||||||||||||||||||
| July 3, 2024 | Quality of life / burden of disease | Quality of life 2011 (ACAM) | People with asthma are more likely to report a poor quality of life. This is more pronounced among people with severe or poorly controlled asthma. | quality-of-life-burden-of-disease | |||||||||||||||||||||||||||||||||||||||||||||||||||||||||||||||||||||||||||||||||||||||||||
| January 4, 2024 | Children and young people, Quality of life / burden of disease | Burden of disease 2023 (AIHW) | In 2023, Asthma was the 10th leading contributor to the total burden of disease in Australia with a disability-adjusted life years (DALY) rate of 5.34 per 1,000 population (141,621 DALY, crude number). By gender: By age groups (age-specific DALY per 1,000), asthma ranked as leading cause of total burden of disease: Note: to compare epidemiological data, it is usually preferred to use age-standardised statistics to ensure the differences are not caused by variations in age structure and an ageing population, unless the data is for specific age ranges in which case “crude” age-specific statistics are used. | children-and-young-people quality-of-life-burden-of-disease | |||||||||||||||||||||||||||||||||||||||||||||||||||||||||||||||||||||||||||||||||||||||||||
| January 2, 2024 | Aboriginal and Torres Strait Islander People, Comorbidities and Risk Factors, Deaths, Emergency Department Presentations, Hospitalisation, Prevalence, Quality of life / burden of disease | A summary of asthma health among First Nations peoples 2018-2019 to 2021-2022 (AIHW) | AIHW report providing summary of epidemiological data in First Nations peoples with asthma (prevalence, risk factors, quality of life, burden of disease, mortality, hospitalisations, ED). This report provides a nice summary and a single reference. Prevalence (2018-2019 National Aboriginal and Torres Strait Islander Health survey (NATSIHS): Hospitalisation rates (2021-2022): Emergency Departments visits (2021-2022 Non-admitted Patient Emergency Department Care database): Mortality (2017-2021): Burden of Disease (Australian Burden of Disease Study 2018): Risk factors for First Nations people with asthma compared to those without asthma (2018–2019 NATSIHS): Quality of life (2018–2019 NATSIHS) for adult First nations people with asthma compared to those without asthma: Asthma Management in First Nations people with asthma (2018–2019 NATSIHS): | aboriginal-and-torres-strait-islander-people comorbidities-and-risk-factors deaths emergency-department-ed-presentations hospitalisation prevalence quality-of-life-burden-of-disease | |||||||||||||||||||||||||||||||||||||||||||||||||||||||||||||||||||||||||||||||||||||||||||
| December 14, 2022 | Children and young people, Quality of life / burden of disease | Burden of disease 2022 (AIHW) | Asthma was the 8th leading contributor to the total burden of disease in Australia in 2022, with a disability-adjusted life years (DALY) age-standardised rate of 5.2 per 1,000 population (138,048 DALY) compared to 9th in 2018 and 10th in 2003. This represents a 7.8% change since 2003. In, 2022, 5.9% of the asthma burden was fatal (8,087 years of life lost), and 94.1% was non-fatal (129,954 years lived with disability). Asthma contributed 2.5% to the total burden in Australia. By sex and age groups, asthma ranked (age-specific DALY rates): | children-and-young-people quality-of-life-burden-of-disease | |||||||||||||||||||||||||||||||||||||||||||||||||||||||||||||||||||||||||||||||||||||||||||
| July 27, 2022 | Children and young people, Quality of life / burden of disease | Impact of childhood asthma on academic performance in NSW (2005-2018) | Cohort study of people aged up to 18 years old hospitalised for asthma during 2005-2018 in NSW, Australia, looking at school performance.
Conclusions: Educational attainment is worse for young people hospitalized with asthma compared to matched peers. Early intervention and strategies for better management of asthma symptoms may enhance academic performance for students. | children-and-young-people quality-of-life-burden-of-disease | |||||||||||||||||||||||||||||||||||||||||||||||||||||||||||||||||||||||||||||||||||||||||||
| December 1, 2021 | Children and young people, Quality of life / burden of disease | Burden of disease 2018 (AIHW) | Asthma was the 9th leading contributor to the total burden of disease in Australia in 2018, with a disability-adjusted life years (DALY) rate of 5.2 per 1,000 population, compared to 10th in 2003. Asthma was the 4th leading cause of non-fatal disease burden in 2018 (from 5th in 2003). The equivalent of 130,886 years of healthy life were lost due to asthma in 2018, including 123,315 of these due to years lived with a disability. Asthma was the leading cause of total burden in children aged 5-14, contributing to 14% and 11% of the total burden in boys and girls, respectively. It was the leading cause of non-fatal burden for children aged under 5. By age groups, asthma’s total burden of disease ranked: 5th in children aged under 5; 1st in all children aged 5-14 (1st in males and 2nd in females); 5th in males and 4th in females aged 15-24; 8th in males and 4th in females aged 25-44; 10th in males and 6th in females aged 45-54; 10th in females aged 55-64; higher than 10th in males aged over 54 and females aged over 64. (see Fig 2.6 and 2.7 for DALY rates and proportions) By age groups, asthma’s non-fatal burden of disease ranked: 1st in children aged under 5; 1st in males and 2nd in females aged 5-14; 3rd in males and 4th in females aged 15-24; 6th in males and 4th in females aged 25-44; 5th in both males and females aged 45-54; 8th in males and 6th in females aged 55-64; 8th in females aged 65-74; higher than 10th in males aged over 64 and females aged over 74. Asthma was the 10th leading cause of fatal burden in males and 7th in females aged 5-14. Note that the report also contains data specific to states, remoteness and socioeconomic groups. | children-and-young-people quality-of-life-burden-of-disease | |||||||||||||||||||||||||||||||||||||||||||||||||||||||||||||||||||||||||||||||||||||||||||
| October 8, 2021 | Aboriginal and Torres Strait Islander People, Quality of life / burden of disease | Burden of Disease in First Nations peoples 2018 (AIHW) | According to the Australian Burden of Disease Study 2018, asthma was, in First Nations people: (ref 1) Comment: Note important variation between age-standardised (below) and crude (above) burden of disease ranking for First Nations people, due to the differences in age structure between First Nations (younger population) and non-Indigenous Australians. Key findings from the Australian Burden of Disease Study (ABDS) 2018 also include: | aboriginal-and-torres-strait-islander-people quality-of-life-burden-of-disease | |||||||||||||||||||||||||||||||||||||||||||||||||||||||||||||||||||||||||||||||||||||||||||
| September 28, 2021 | Air Quality, Deaths, Quality of life / burden of disease, Wood Heaters | Mortality and years of life lost due to wood heaters, Armidale 2018-2019 (published 2021) | An Australian study to estimate the annual burden of mortality and the associated health costs attributable to air pollution from wood heaters in Armidale, a regional Australian city (population, 24 504) with high levels of air pollution in winter caused by domestic wood heaters, 1 May 2018 – 30 April 2019. The health impact (excess annual mortality and financial costs) was assessed based upon atmospheric PM2.5 measurements. Research article in MJA, single study | air-quality deaths quality-of-life-burden-of-disease wood-heaters-air-quality | |||||||||||||||||||||||||||||||||||||||||||||||||||||||||||||||||||||||||||||||||||||||||||
| July 1, 2021 | Air Quality, Deaths, Quality of life / burden of disease | Years of life lost in Australia due to air pollution 2011 (AIHW) | According to the Burden of Disease report, at least 3,000 deaths (equivalent to about 28,000 years of life lost) per year in Australia are attributable to air pollution. | air-quality deaths quality-of-life-burden-of-disease | |||||||||||||||||||||||||||||||||||||||||||||||||||||||||||||||||||||||||||||||||||||||||||
| July 1, 2021 | Comorbidities and Risk Factors, Quality of life / burden of disease | Overweight and obesity contribution to burden of disease 2015 (AIHW) | Overweight and obesity is responsible for approximately 24% of the burden of disease due to asthma in 2015. | comorbidities-and-risk-factors quality-of-life-burden-of-disease | |||||||||||||||||||||||||||||||||||||||||||||||||||||||||||||||||||||||||||||||||||||||||||
| July 1, 2021 | General Practice Encounters, Medication use and asthma control, Quality of life / burden of disease | Self-reported general practitioner, specialist or other health professional visits: NHS 2014-15 (ABS) | Self-reported GP visits in 2014-15, or other actions taken.
note: data is percentage (%) Note: table 7 also contains information on:
| general-practice-encounters medication-use-and-asthma-control quality-of-life-burden-of-disease | |||||||||||||||||||||||||||||||||||||||||||||||||||||||||||||||||||||||||||||||||||||||||||
| July 1, 2021 | Children and young people, Quality of life / burden of disease | Burden of disease 2015 (AIHW) | Asthma was the 10th leading contributor to the overall burden of disease in Australia in 2015 (5th leading cause of non-fatal disease burden). The equivalent of 120,774 years of health life were lost due to asthma in 2015. 113,129 of these due to years lived with a disability and 7,645 due to premature death. | children-and-young-people quality-of-life-burden-of-disease | |||||||||||||||||||||||||||||||||||||||||||||||||||||||||||||||||||||||||||||||||||||||||||
| July 1, 2021 | Quality of life / burden of disease | Quality of life / self-assessed health 2017-2018 (ABS, NHS) | According to the National Health Survey 2017-2018, for adults aged 18 years and over with asthma, their self-assessed health was generally regarded more poorly when compared to the total population. Only one in ten (10.1%) people with asthma rated themselves as having excellent health, half that of the total population (20.2%).
| quality-of-life-burden-of-disease | |||||||||||||||||||||||||||||||||||||||||||||||||||||||||||||||||||||||||||||||||||||||||||
| July 1, 2021 | Children and young people, Quality of life / burden of disease | Impacts on school and daily activities 2017 (ABS) | In 2014/15
| children-and-young-people quality-of-life-burden-of-disease | |||||||||||||||||||||||||||||||||||||||||||||||||||||||||||||||||||||||||||||||||||||||||||
| July 1, 2021 | Quality of life / burden of disease | Health literacy among people with asthma compared to other health conditions 2018 (ABS) | People with asthma have the lowest overall health literacy according to a first-of-its-kind national health survey conducted by the Australian Bureau of Statistics (ABS). Alongside people with mental health and behaviour problems, those with asthma indicated they struggle more with managing their health and engaging with healthcare providers than those with other long-term health conditions. | quality-of-life-burden-of-disease | |||||||||||||||||||||||||||||||||||||||||||||||||||||||||||||||||||||||||||||||||||||||||||
| July 1, 2021 | Medication use and asthma control, PEEK Report, Quality of life / burden of disease | Experience of asthma in the Australian health system: a qualitative study 2019 (PEEK report) | Experience of asthma in the Australian health system from first symptoms, diagnosis, treatment and future expectations, a qualitative study 2019: Mixed method study of 100 people with asthma Report includes sections on: symptoms and diagnosis, decision-making, treatment and health service provision, communication and information, care and support, quality of life and experience in the health system, and expectations. Refer to section 5 for information on treatment and medications. | medication-use-and-asthma-control peek-report quality-of-life-burden-of-disease | |||||||||||||||||||||||||||||||||||||||||||||||||||||||||||||||||||||||||||||||||||||||||||
| July 1, 2021 | Quality of life / burden of disease | Absenteism / impacts on work (hidden cost of asthma report 2015, Deloitte) | People with asthma are absent from work on average 2.1 days more per year than people without asthma. | quality-of-life-burden-of-disease | |||||||||||||||||||||||||||||||||||||||||||||||||||||||||||||||||||||||||||||||||||||||||||